Anonymized · prop trading firm
Internal trader & ops dashboard
One pane of glass replaced ~80% of the 'can you check…' interrupts hitting eng each day.
- Role
- Owner · full-stack
- Year
- 2025
- Read
- 2 min read
- eng interrupts/week −80%
- p95 page load (busiest screen) < 400ms
- DAU after launch 10–20
- shipped solo in ~6 weeks
Outcome. Built a Flask + MySQL dashboard that traders and ops use to see positions in real time and run reconciliations on demand. Default tab for the people it was built for; ~80% drop in the “can you check…” interrupts that used to hit engineering each day.
Context
Engineering was spending an outsized share of its day answering questions that lived in our own database — “what’s my position in X right now?”, “did the 11am batch run?”, “why did this fill get rejected?”. The fix wasn’t more docs. It was a single pane of glass that put the right answer in front of the person asking it.
My role
Owner. Frontend, backend, deploy. Worked closely with two traders and one ops lead for the information architecture.
Approach
The first version was a single page with everything on it — every position, every batch status, every queue depth. Completely overwhelming. Nobody used it. I reset.
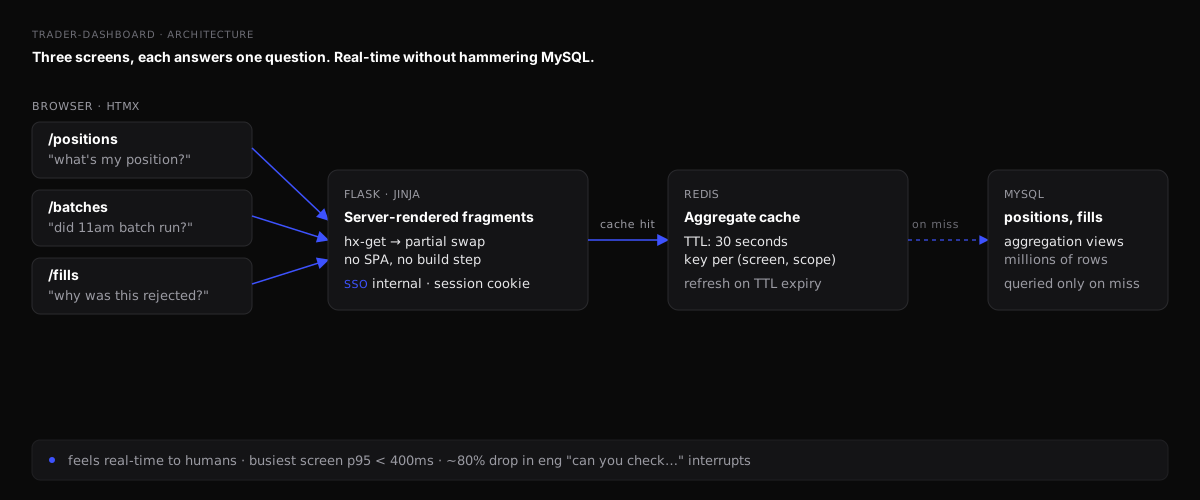
The second version started from a different premise: every screen should answer one question. Three screens replaced the one. Adoption went from “no one” to “default tab” within a week of the v2 cut.
The backend constraint was that queries had to feel real-time on a position table with millions of rows. The trick wasn’t to make MySQL faster — it was to cache aggregates at the boundary with a 30-second Redis TTL, not at the row level. The dashboard hits Redis on every refresh and MySQL only when a TTL expires, so it feels real-time to humans without hammering the database.
A small thing that mattered: HTMX-style partial refreshes for the panels that change often. No SPA, no React, no build step. Server-rendered Flask with surgical fragment swaps. Boring and correct.
Architecture
Results
- Engineering interrupts/week: down ~80% (measured by counting inbound Slack messages to the eng channel before and after launch).
- Busiest screen, page load: p95 < 400ms.
- Daily active users among traders and ops: 10–20.
- Net new lines of SQL: ~200–400 (mostly aggregation views).
What I’d do differently
I’d have shipped one screen — the highest-traffic question — first, gathered usage for two weeks, then added the other two. I shipped all three at once, and learned afterward which one was load-bearing. Smaller slices, faster feedback, same destination.
- Python
- Flask
- MySQL
- Redis
- HTMX